This post contains affiliate links, and Amazon associate links which means I may earn a commission at no extra cost to you if you buy through them, and it may also include links to my own paid digital products. I use AI tools to help with drafting and editing; however, every post is reviewed, fact-checked, and approved by me before publication, and all client results and numbers are real.
A client came to us, spending $15,000 a week on Meta. Good creative. Strong funnel. Solid returns. The kind of brand most agencies would call “dialed in.”
Her Pinterest account had 47 followers and a board called “Inspo.”
Four months later, she was pulling $93,000 revenue from Pinterest alone. ROAS consistently between 4.2x and 6.7x. Meta kept performing. Pinterest started compounding in a way that Meta structurally cannot.
That gap between “47 followers, board called Inspo” and “$93K weeks” is what this post is about.
This goes beyond setting up a business account and pinning product photos. If you’re an ecommerce brand already investing in paid acquisition, this is the strategic breakdown of why Pinterest belongs in your media mix, how the economics actually work, and what it takes to build an infrastructure that compounds instead of expires.
Why Pinterest Performs Differently Than Every Other Ecommerce Channel
Most ecommerce advertising is rented visibility. You pay today, you’re visible today. You stop paying, you disappear.
Pinterest operates on a fundamentally different model. It functions as search infrastructure with visual distribution. That distinction matters for one critical reason: content longevity.
A pin you create today can generate clicks, saves, and sales eighteen months from now. A Meta ad stops performing the moment your budget runs out. An Instagram Reel has a 48-hour window before it’s buried under the next batch of content.
Pinterest’s structural advantages for ecommerce brands include:
The platform reaches over 500 million monthly active users, and 96% of searches on Pinterest are unbranded. That means your products can surface alongside major retailers without needing their brand recognition or their ad budget. A $200K/year skincare brand sits in the same search results as a $200M/year conglomerate.
Pinterest users also carry higher purchase intent than users on any other visual platform. They arrive searching for products and solutions, not scrolling past them. The average order value on Pinterest is consistently higher than Meta, Instagram, or TikTok, with some categories seeing AOVs 20-40% above cross-channel averages.
The Real Numbers: What Pinterest for Ecommerce ROAS Looks Like
Theory is useful. Data is better. Here’s what we’re seeing across active ecommerce accounts right now.
Mira (Beauty and Wellness Brand)
Mira is an established beauty and wellness ecommerce brand running Pinterest as a core part of their paid media strategy.
The numbers over a 15-week period (October 2025 through January 2026):
Weekly revenue from Pinterest ranged from $49,000 to $93,000. ROAS held consistently between 4.2x and 6.7x on weekly ad spend of $11,000 to $15,000. Average order value ranged from $122 to $168. Outbound clicks grew from 7,400 to 14,900 per week. Outbound click-through rate averaged between 0.65% and 1.41%.
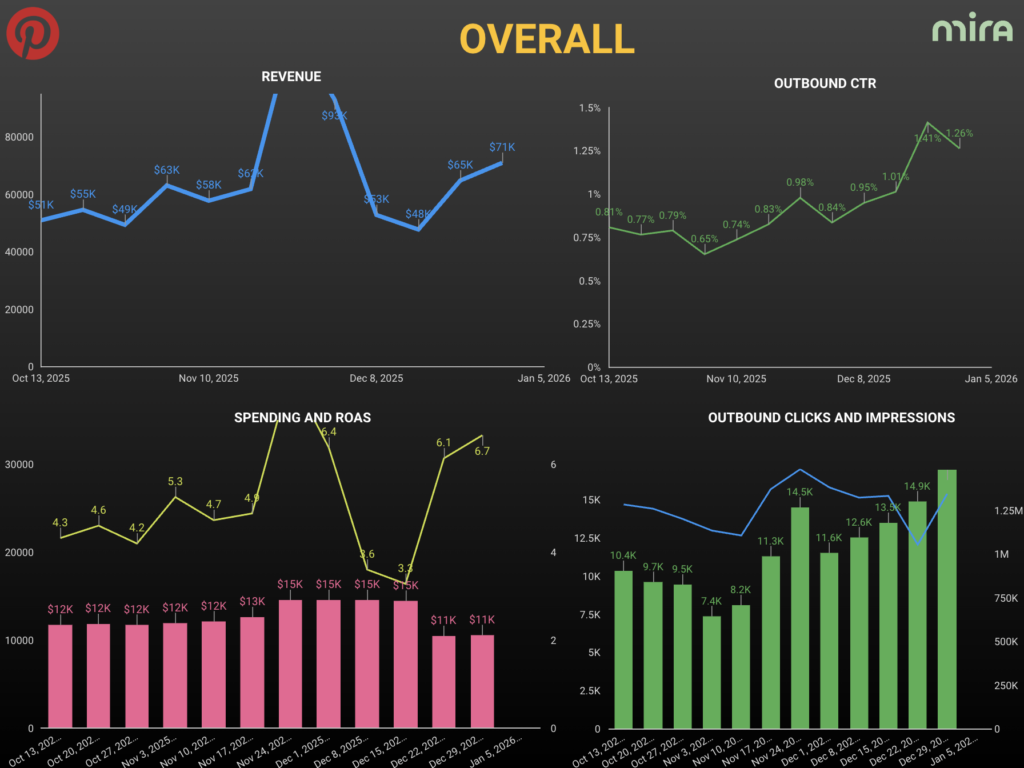
What stands out is the consistency. This is not a single spike during a promotional window. Mira’s Pinterest account performed at this level week after week because the underlying infrastructure, the keyword architecture, the pin strategy, the board taxonomy, was engineered for compounding visibility.
A Premium Body Care Brand (Name Under NDA)
This brand came to us already running Meta, Google, and Snapchat. Pinterest was the weakest channel in the mix, with an iROAS of 0.39.
Within one quarter, Pinterest iROAS climbed to 1.40, a 259% increase. In a single week in March 2026, the Pinterest account generated $33,377 in conversion value on $7,150 in spend, producing a platform ROAS of 4.67x against a target of 1.30x.
The metrics that moved alongside revenue: iCPA dropped from $186.70 to $27.98, an 85% improvement. AOV increased from $72.81 to $80.71.

The broader business context matters here too. The brand’s overall contribution margin hit $577,536 on $1.45 million in net sales. Repeat rate reached 40%. New customer revenue hit $853,861. Pinterest didn’t create that business health, but it became a meaningful acquisition channel that compounded alongside the existing paid strategy instead of competing with it.
Elizabeth Silver Design (Surface Design and Digital Products)
Elizabeth Silver’s business sits at the intersection of physical products, digital downloads, and courses. A smaller operation with a more modest ad budget.
Over a four-month campaign window (September 2025 through January 2026): total Pinterest ad spend of $75.66 generated 13,909 impressions, 82 outbound clicks, and 17 signups at a $4.45 CPA. Across all campaigns during that period, total order value reached $2,881 on 45 checkouts with a blended ROAS of 1.21x.
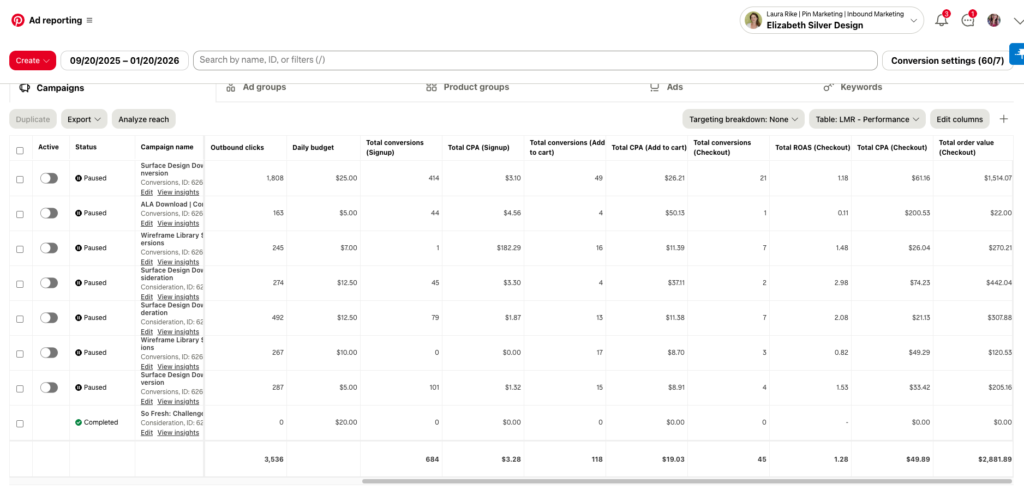
The standout performer was the Surface Design Download conversion campaign, which produced 414 signups at $3.10 CPA, 21 checkouts at a $61.16 CPA, and $1,514 in order value. ROAS on that single campaign hit 1.18x, with the Consideration variations reaching 2.98x.
Impressions scaled from roughly 10,000 to 50,000 per week over the campaign period. Outbound clicks grew from 111 to 271 per week. That growth curve illustrates what happens when the algorithm has enough data and enough properly optimized content to work with.
Daily Dose (Superfoods and Nutrition, Shopify)
Daily Dose is a Shopify-based nutrition brand that started with organic Pinterest only, no ad spend.
Over a 60-day window (January through March 2026), organic Pinterest generated $485 in attributed revenue, a 304% increase. Page visits hit 1,700, up 42%. Add to carts increased 666%. Checkouts grew 300%. Average order value held at $60.63.
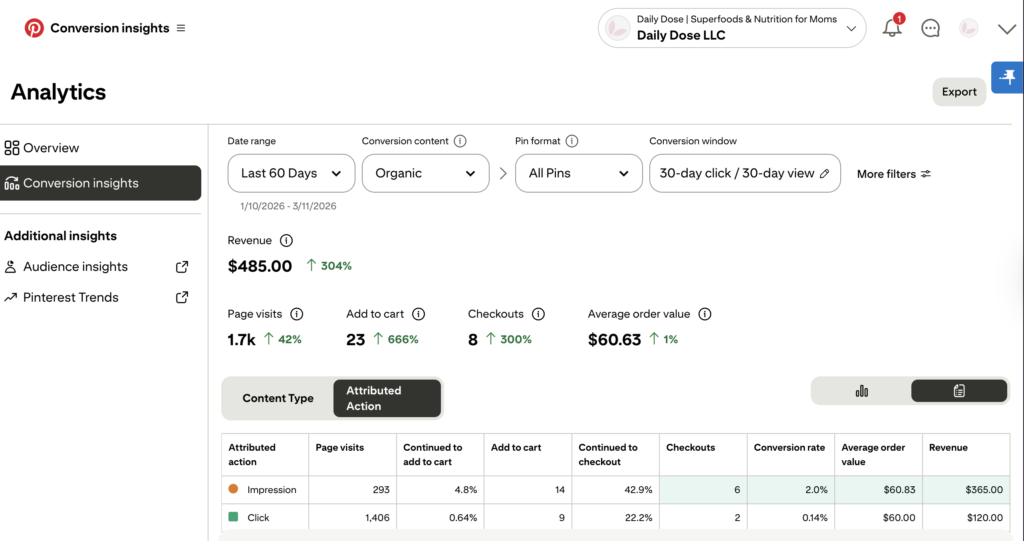
The impression-to-checkout conversion rate was 2.0%, with a $60.83 AOV on impression-attributed conversions.
These are organic numbers. No ad spend. The Shopify-Pinterest catalog integration, combined with strategic keyword optimization and board architecture, drove product discovery through search alone.
Pinterest Ads vs. Meta Ads: What the Data Actually Shows on Pinterest for ecommerce
The strongest ecommerce brands run both. This is an allocation conversation, and the data makes a clear case. The question is how to allocate budget based on what each channel does structurally.
Meta’s strengths: fast feedback loops, sophisticated audience targeting, strong for launches and promotions, excellent retargeting infrastructure.
Meta’s structural limitation: every dollar of ad spend has a half-life. The moment you stop spending, the visibility stops. Content does not compound. You are renting attention on a daily basis.
Pinterest’s strengths: content compounds over time, search-based intent delivers higher-quality traffic, AOV trends higher, creative assets have longer shelf lives, and the platform rewards precision over volume.
Pinterest’s structural reality: the compounding timeline means results build slower in the first 30-60 days. This is not a weakness. It’s the mechanism that produces the outsized returns at month six and beyond.
The premium body care brand we referenced above illustrates the interplay perfectly. Their CTC Prophit System data showed Pinterest conversion value at $33,377 against a goal of $13,266, hitting 152% of target. In the same period, Snapchat conversion value sat at $35,666 against a $44,933 goal, reaching only 79%.
Pinterest outperformed its goal by more than half. Snapchat missed by more than 20%.
The difference came down to infrastructure. Pinterest had been engineered for compounding. Snapchat was running on volume alone.
How Ecommerce Platforms Integrate with Pinterest Shopping Features
The technical infrastructure matters as much as the strategy. Pinterest’s shopping ecosystem has matured significantly, and the integration capabilities vary by platform.
Shopify
Shopify’s native Pinterest integration is the most seamless available. It enables automatic product catalog syncing, so your entire product feed updates daily without manual intervention. Rich Pins pull product data (pricing, availability, descriptions) directly from your Shopify store. The Pinterest Tag (conversion tracking pixel) installs with a few clicks through the Shopify app.
Becoming a Verified Merchant through the Shopify-Pinterest connection unlocks access to shopping-specific features: product pins display real-time pricing, availability badges, and direct purchase links. We’ve seen accounts generate sales directly from the catalog connection before running a single promoted pin.
WooCommerce
WooCommerce integrates through the Pinterest for WooCommerce plugin. Product catalog syncing, Rich Pins, and the Pinterest Tag are all supported, though the setup requires more manual configuration than Shopify.
BigCommerce and Other Platforms
BigCommerce, Salesforce Commerce Cloud, and other major ecommerce platforms support Pinterest catalog integration either natively or through feed management tools. The core requirements are the same: a clean product feed, the Pinterest Tag installed site-wide, and Verified Merchant status.
Regardless of platform, the integration checklist is straightforward: install the Pinterest Tag for conversion tracking, connect your product catalog for automatic syncing, apply for Verified Merchant status, and enable Rich Pins across your product inventory.
What Types of Product Pins Drive Ecommerce Conversions
Each pin format serves a different role in the buyer’s search journey. Matching the format to the intent is where the leverage lives.
Standard Product Pins remain the workhorse for ecommerce. A high-quality product image with a clear, keyword-optimized title and description, linking directly to the product page. These perform best when the product solves a specific, searchable problem.
Video Pins have gained significant traction for product demonstration and unboxing content. The premium body care brand we work with runs video-based conversion campaigns (body mist, body oil, body wash) that consistently outperform static creative for new customer acquisition.
Collection Pins allow you to feature a hero image with supporting product images below, creating a curated shopping experience within the pin itself. These work particularly well for brands with coordinated product lines.
Catalog Pins auto-generate from your connected product feed and appear in shopping-specific placements. These require less creative production but benefit enormously from optimized product data in your ecommerce platform.
The pattern across all high-performing ecommerce Pinterest accounts: they use multiple pin formats strategically, not randomly. Video for prospecting. Standard product pins for search-intent capture. Collections for cross-selling. Catalog pins for always-on product visibility.
Measuring Pinterest for Ecommerce ROI: The KPIs That Matter
Pinterest analytics for ecommerce requires a different framework than Meta or Google reporting. The compounding nature of the platform means standard 7-day or even 30-day attribution windows can significantly undercount Pinterest’s contribution.
The Core Metrics
Outbound Click-Through Rate (CTR): Measures how effectively your pins drive traffic to your site. Healthy ecommerce CTR on Pinterest ranges from 0.5% to 1.5%. Mira’s account consistently hit 0.65% to 1.41% across a 15-week period.
Return on Ad Spend (ROAS): The headline metric, but context matters. Pinterest ROAS compounds, which means early-period ROAS will understate long-term performance. Elizabeth Silver’s campaigns showed ROAS ranging from 1.18x to 2.98x depending on campaign objective and maturity.
Cost Per Acquisition (CPA): Track this at multiple conversion events: signup, add to cart, and checkout. The premium body care brand’s iCPA dropped from $186.70 to $27.98 over one quarter, an 85% improvement, as the account infrastructure matured and the algorithm optimized.
Average Order Value (AOV): Pinterest consistently delivers higher AOV than other social channels. The premium body care brand saw AOV increase from $72.81 to $80.71, an 11% lift, as Pinterest-sourced traffic quality improved.
Impression Growth: A leading indicator of compounding visibility. Elizabeth Silver’s weekly impressions grew from approximately 10,000 to 50,000 over four months. That growth curve continues even during weeks with flat or reduced ad spend, because organic distribution amplifies paid content.
Attribution and Tracking
Pinterest’s native analytics provide conversion insights segmented by impression-attributed and click-attributed actions. For Daily Dose, impression-attributed conversions showed a 2.0% conversion rate and $60.83 AOV, while click-attributed conversions showed 0.14% conversion rate and $60.00 AOV.
That gap reveals something important: Pinterest influences purchases even when users don’t click through immediately. They see a product, they save it, they return later through a different channel and buy. Standard last-click attribution misses this entirely.
For more sophisticated tracking, tools like Triple Whale and Northbeam provide cross-channel attribution models that capture Pinterest’s contribution more accurately. Triple Whale integrates directly with Shopify. Northbeam offers more precise tracking but at a higher price point.
Pinterest Marketing Tools for Ecommerce Businesses
The right tools reduce the manual overhead and sharpen the data behind every decision. Here’s what we use across client accounts and what’s worth investing in at each stage.
Pinterest Native Analytics is the starting point. The built-in dashboard tracks impressions, saves, outbound clicks, and conversion events at the pin, board, and account level. Pinterest Trends (trends.pinterest.com) is the best free keyword research tool specific to the platform, showing seasonal search volume and emerging product categories.
Tailwind remains the most robust scheduling and analytics platform for Pinterest. Batch-schedule pins across boards, access SmartLoop for evergreen content distribution, and use Tailwind’s analytics to identify which pins and boards drive the most outbound traffic. For ecommerce accounts publishing 10 to 25 pins per day, Tailwind pays for itself in time savings alone.
Triple Whale is the attribution tool of choice for Shopify brands. It integrates directly with Shopify and Pinterest, providing cross-channel attribution that captures view-through conversions standard analytics miss. This is the tool that reveals Pinterest’s true contribution to your revenue, including the purchases that happen through other channels after a Pinterest impression.
Northbeam offers the most precise cross-channel tracking available. Higher price point than Triple Whale, but the accuracy is unmatched for brands running $10K+ monthly across multiple paid channels. The premium body care brand in our case studies uses Northbeam to track Pinterest’s incrementality against Meta and Snapchat.
CTC Prophit System provides contribution margin and channel efficiency analysis. This goes beyond ROAS to show how each channel contributes to actual profit after accounting for COGS, shipping, and ad spend. Useful for brands optimizing toward profitability rather than top-line revenue.
Planoly and Pinterest’s native scheduler serve smaller accounts well. Both handle basic scheduling and content planning. Pinterest’s native scheduler is free and sufficient for brands publishing 5 to 10 pins per day.
The tool stack scales with your Pinterest investment. Start with Pinterest native analytics and a scheduling tool. Add Triple Whale or Northbeam when ad spend crosses $2,000 to $3,000 per month and accurate cross-channel attribution becomes essential to budget allocation decisions.
The Pinterest for Ecommerce Timeline: What to Expect
This is the section most brands need to read twice. Pinterest is a compounding channel. The growth curve is not linear, and the early months will test your patience if you’re benchmarking against Meta’s instant feedback loop.
Days 1-30: Foundation. Account infrastructure goes in. Keyword architecture, board taxonomy, pin templates, catalog connection, pixel verification. You’ll see impressions start to register. Click volume will be modest. Revenue attribution will be minimal. This is proof of concept, not proof of ROI.
Days 31-60: Signal building. The algorithm is learning which content resonates, which keywords drive engagement, which audiences respond. Impression growth accelerates. Click patterns emerge. You can start identifying which product categories and pin formats to double down on.
Days 61-90: Traction. Traffic becomes consistent and measurable. Add to cart events increase. Revenue attribution starts showing up in your analytics. This is where most brands that quit at day 45 would have started seeing returns.
Months 4-6: Compounding. The content you created in month one is still generating impressions. New content builds on the algorithmic authority established by earlier content. Revenue grows without proportional increases in spend. This is where Pinterest starts to feel unreasonable in the best possible way.
Months 6-12: Infrastructure. Pinterest is now a reliable, predictable acquisition channel. The content library compounds. Seasonal trends create predictable revenue spikes. The cost of customer acquisition decreases as organic distribution amplifies paid efforts.
Mira’s trajectory illustrates this clearly. Weekly revenue didn’t start at $93,000. It built there through consistent infrastructure work, and the trajectory continued upward because compounding content doesn’t have a ceiling the way rented visibility does.
Common Mistakes Ecommerce Brands Make on Pinterest
After managing Pinterest strategy for ecommerce brands across multiple verticals, patterns emerge in what doesn’t work.
Treating Pinterest like Instagram. The brands that repurpose their Instagram grid directly to Pinterest almost always underperform. Instagram rewards aesthetic curation and engagement. Pinterest rewards searchability and relevance. The content formats, keyword strategies, and visual approaches are structurally different.
Pinning without keyword architecture. Every pin, every board, every description should be built on keyword research specific to Pinterest’s search ecosystem. Generic product descriptions copied from your website won’t surface in Pinterest search the way keyword-optimized pin titles and descriptions will.
Ignoring board taxonomy. Boards are not aesthetic categories for your brand. They are keyword-organized content libraries that signal to the algorithm what your account is about. A board called “Our Products” tells the algorithm nothing. A board called “Clean Body Wash for Sensitive Skin” tells it exactly which searches to surface your content in.
Expecting Meta timelines. Pinterest compounds. Meta delivers immediately. If you evaluate Pinterest at day 30 using Meta benchmarks, you’ll kill a channel that would have outperformed Meta by month six.
Skipping Verified Merchant status. For Shopify brands especially, Verified Merchant status unlocks shopping-specific features and distribution that non-verified accounts simply cannot access. It’s one of the highest-leverage setup steps and one of the most commonly skipped.
Running ads before the organic foundation exists. Paid amplification works best when there’s an organic infrastructure to amplify. Brands that launch ads on an account with no optimized boards, no keyword architecture, and no content library are paying to amplify nothing.
Pinterest for Ecommerce Advertising Costs: What to Budget
Pinterest ad costs vary by vertical, targeting, and campaign objective, but the economics are favorable compared to Meta for most ecommerce categories.
Based on active client accounts, here’s what we see in practice:
Cost per click (CPC): Ranges from $0.78 to $1.58 for ecommerce product campaigns. Elizabeth Silver’s best-performing ad achieved $0.78 CPC on a conversion-optimized video campaign.
Cost per signup/lead: $3.10 to $4.56 depending on offer type and funnel structure.
Cost per checkout: Highly variable based on product price and funnel complexity. We’ve seen ranges from $21.13 to $92.38, with the wide spread reflecting differences in product AOV and purchase consideration length.
Minimum viable budget: You can test Pinterest ads effectively with $25 to $50 per day. Scaling typically happens at $100+/day as the algorithm gathers enough conversion data to optimize efficiently.
Scaling budgets: Mira’s $11,000 to $15,000 weekly spend represents a mature, scaled account. The premium body care brand runs $7,000 to $7,500 weekly on Pinterest alongside larger Meta and Snapchat budgets. Elizabeth Silver ran effective campaigns at $5 to $25 per day.
The cost structure rewards patience and precision. Accounts with strong keyword architecture and optimized creative consistently achieve lower CPCs and higher ROAS than accounts running generic targeting with repurposed Meta creative.
Building a Pinterest for Ecommerce Strategy That Compounds
Everything above leads to one structural principle: Pinterest rewards infrastructure over hustle.
The brands generating $93,000 revenue weeks and 4.67x ROAS didn’t get there by pinning more. They got there by building systems that make every pin, every board, and every keyword work harder and longer than content on any other platform.
That system has four components: foundation (keyword architecture, board taxonomy, verified merchant status), system (content workflows, scheduling, analytics tracking), strategy (search-driven content that matches high-intent user behavior), and scale (targeted ads, advanced analytics, funnel alignment).
The compounding nature of Pinterest means the investment you make today continues generating returns months and years from now. A $3,000 investment in Pinterest infrastructure in month one is still working in month eighteen. A $3,000 Meta campaign from month one stopped working the day the budget ran out.
For ecommerce brands already running profitable paid acquisition on other channels, Pinterest serves as a compounding layer that diversifies your acquisition mix, reduces your dependency on any single algorithm, and builds an asset that appreciates instead of depreciates.
Frequently Asked Questions
How can ecommerce businesses use Pinterest analytics to improve their marketing?
Pinterest provides conversion insights segmented by impression-attributed and click-attributed actions. For ecommerce, the most actionable metrics are outbound CTR (target 0.5%-1.5%), CPA at each funnel stage (signup, add to cart, checkout), and impression growth as a leading indicator of compounding visibility. Cross-reference Pinterest analytics with tools like Triple Whale or Northbeam for accurate cross-channel attribution.
What are the typical costs of Pinterest advertising for ecommerce?
Pinterest CPCs for ecommerce typically range from $0.78 to $1.58. Cost per lead runs $3.10 to $4.56. Cost per checkout varies widely by product AOV, from roughly $21 to $92. Minimum viable daily budgets start at $25 to $50, with scaling happening at $100+/day as the algorithm gathers sufficient conversion data.
Which ecommerce platforms integrate best with Pinterest?
Shopify offers the most seamless Pinterest integration, with native catalog syncing, automatic Rich Pins, one-click Pinterest Tag installation, and direct Verified Merchant application. WooCommerce supports full integration through the Pinterest for WooCommerce plugin. BigCommerce and Salesforce Commerce Cloud also support Pinterest catalog integration through native or feed management tools.
Can I track ecommerce sales from Pinterest campaigns?
Yes. The Pinterest Tag tracks page visits, add to carts, checkouts, and revenue at the campaign, ad group, and individual ad level. For cross-channel attribution, tools like Triple Whale (best for Shopify) and Northbeam (most precise tracking) capture Pinterest’s contribution including view-through conversions that standard last-click models miss.
What types of product pins work best for ecommerce?
Standard product pins remain the highest-volume converter for search-intent traffic. Video pins outperform static creative for new customer prospecting. Collection pins drive cross-sell and upsell. Catalog pins provide always-on product visibility with minimal creative production. The strongest accounts use all formats strategically rather than relying on one.
How long does it take to see results from Pinterest ecommerce marketing?
The first 30 days establish infrastructure and proof of concept. Days 31-60 build algorithmic signal and show impression growth. Days 61-90 deliver measurable traffic and initial revenue attribution. Months 4-6 is where compounding becomes visible and ROI accelerates. By month 6, Pinterest typically becomes a predictable, reliable acquisition channel.


